Cynthia SC (08-28-2025)
1. Background
These notes highlight strategies and resources for the downstream analysis of single-cell chromatin accessibility.
The main goal is to compile practical references and methods to support the identification of candidate cis-regulatory elements (cCREs) for advanced analysis — including tasks such as linking peaks to genes or computing differentially accessible regions (DARs).
Calling snATAC-seq peaks using MACS2 and linking peaks to genes
The following video provides a summary of the main topics discussed in this section:
A big thanks to Leonardo Collado-Torres from Lieber Institute for Brain Development for compiling and editing this recording.
Diagrams and concept maps
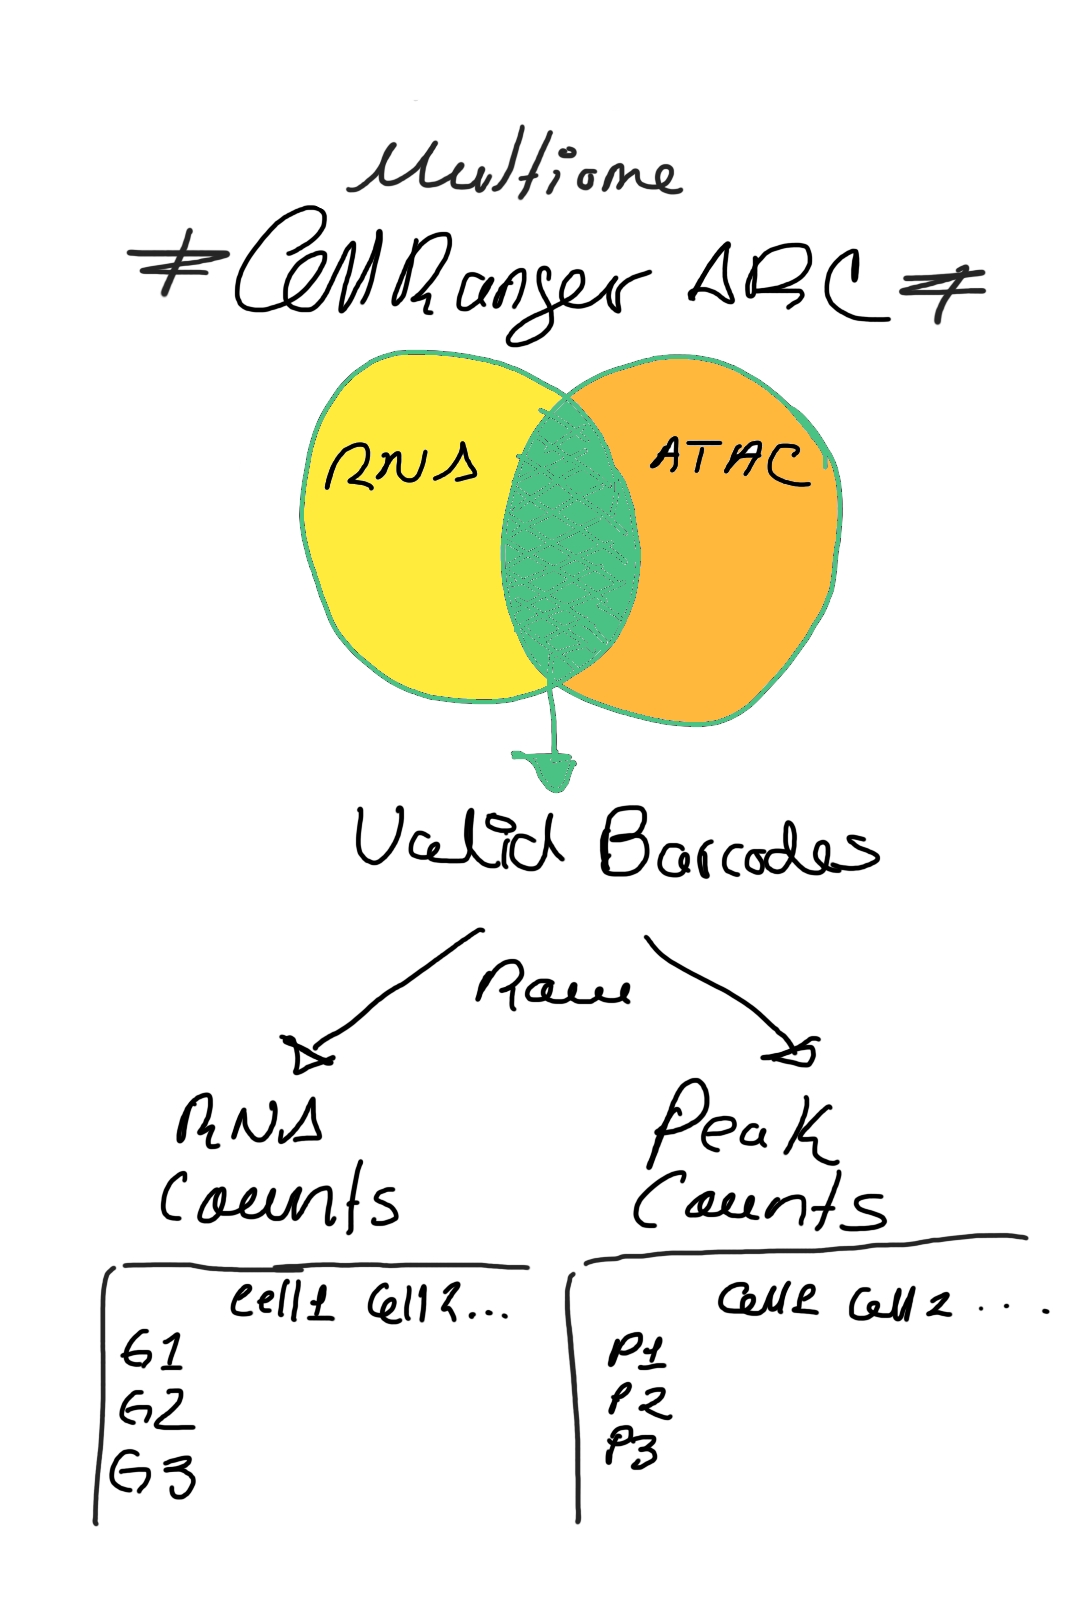
When working with multiome data (RNA + ATAC), Cell Ranger ARC processes the raw data and identifies valid barcodes that contain both RNA and ATAC information. From here, we can build two parallel matrices: one for gene expression counts and another for peak accessibility counts (Image 1).
CellRanger default peak calls
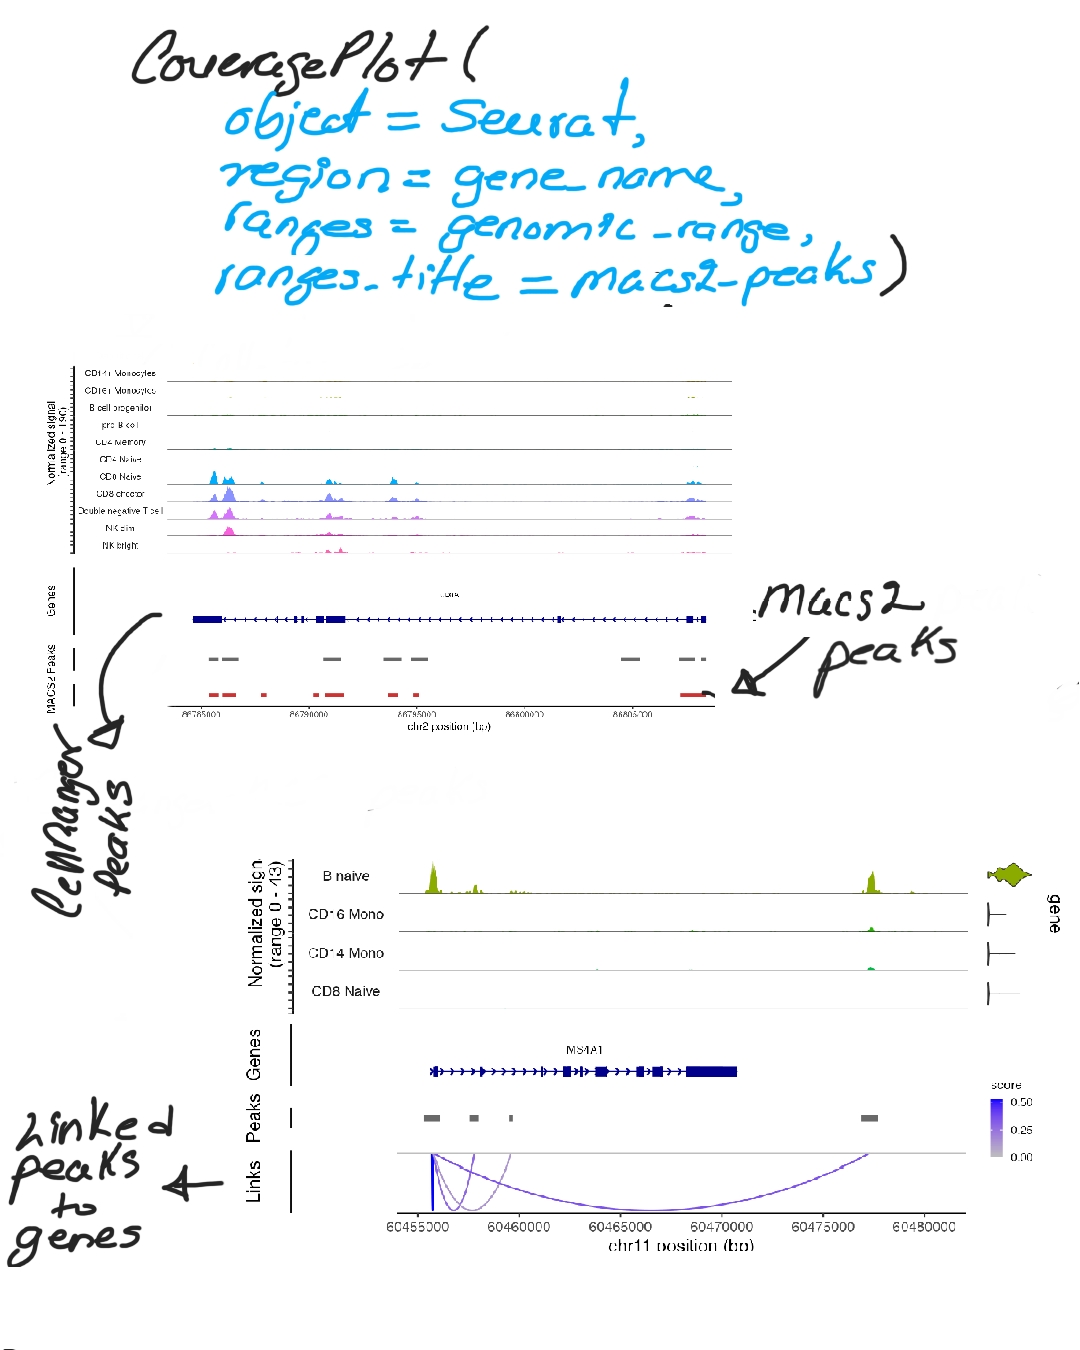
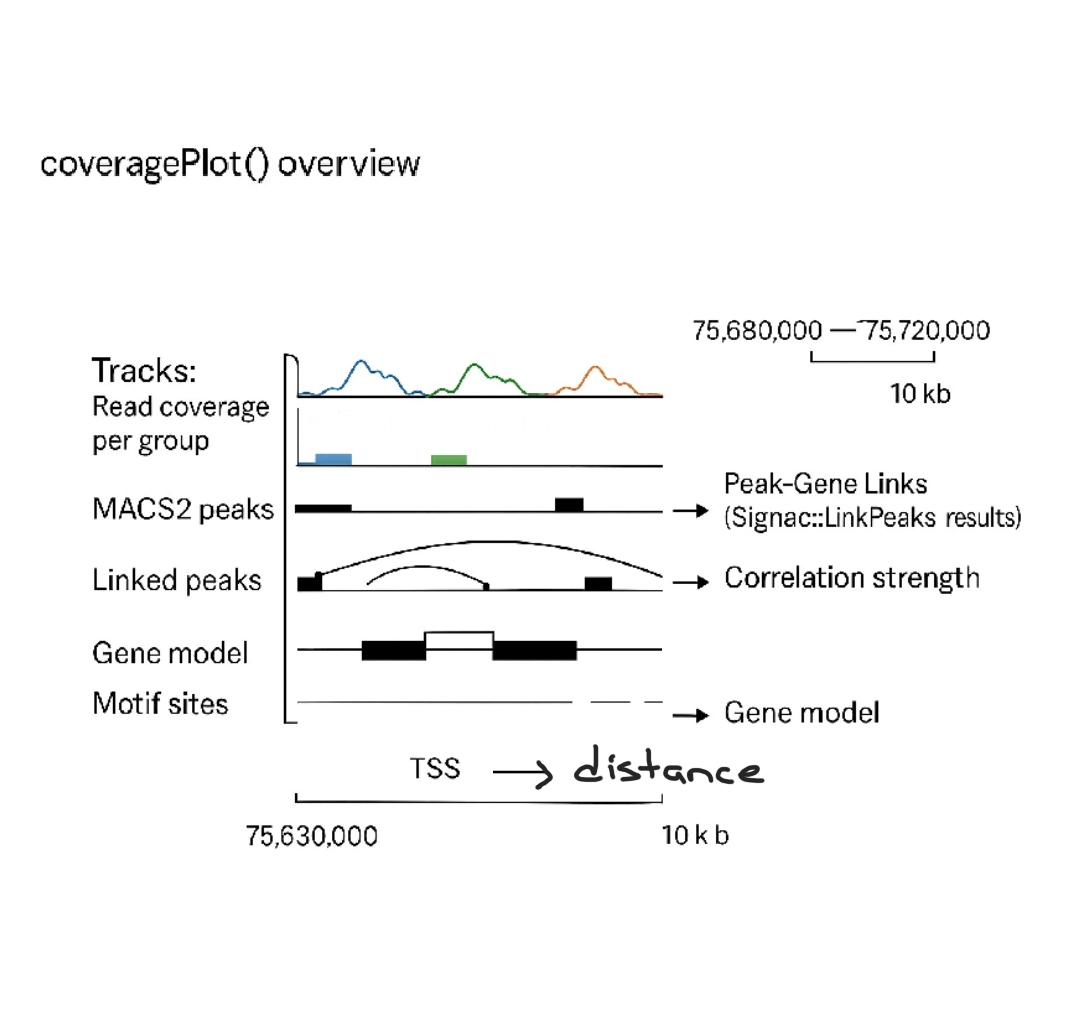
To explore regulatory landscapes, we visualize read coverage and chromatin features with CoveragePlot(), which overlays MACS2-called peaks, linked peak–gene relationships, and the gene model (Images 2–3). This provides a clear view of how open chromatin regions may regulate transcription.
Peak overview (click to open)
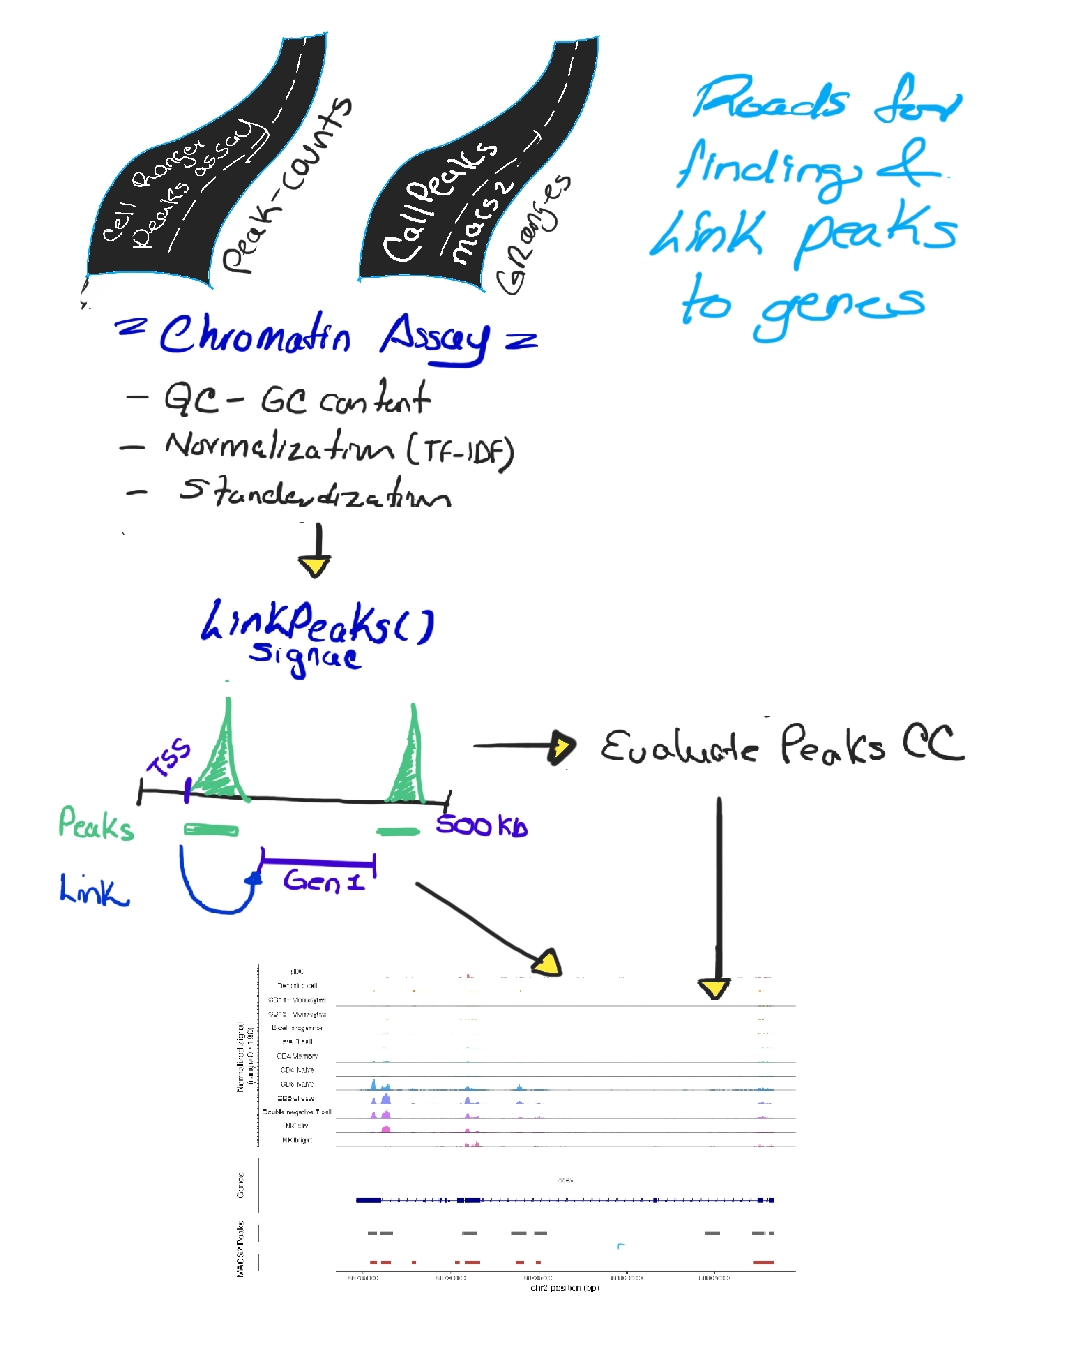
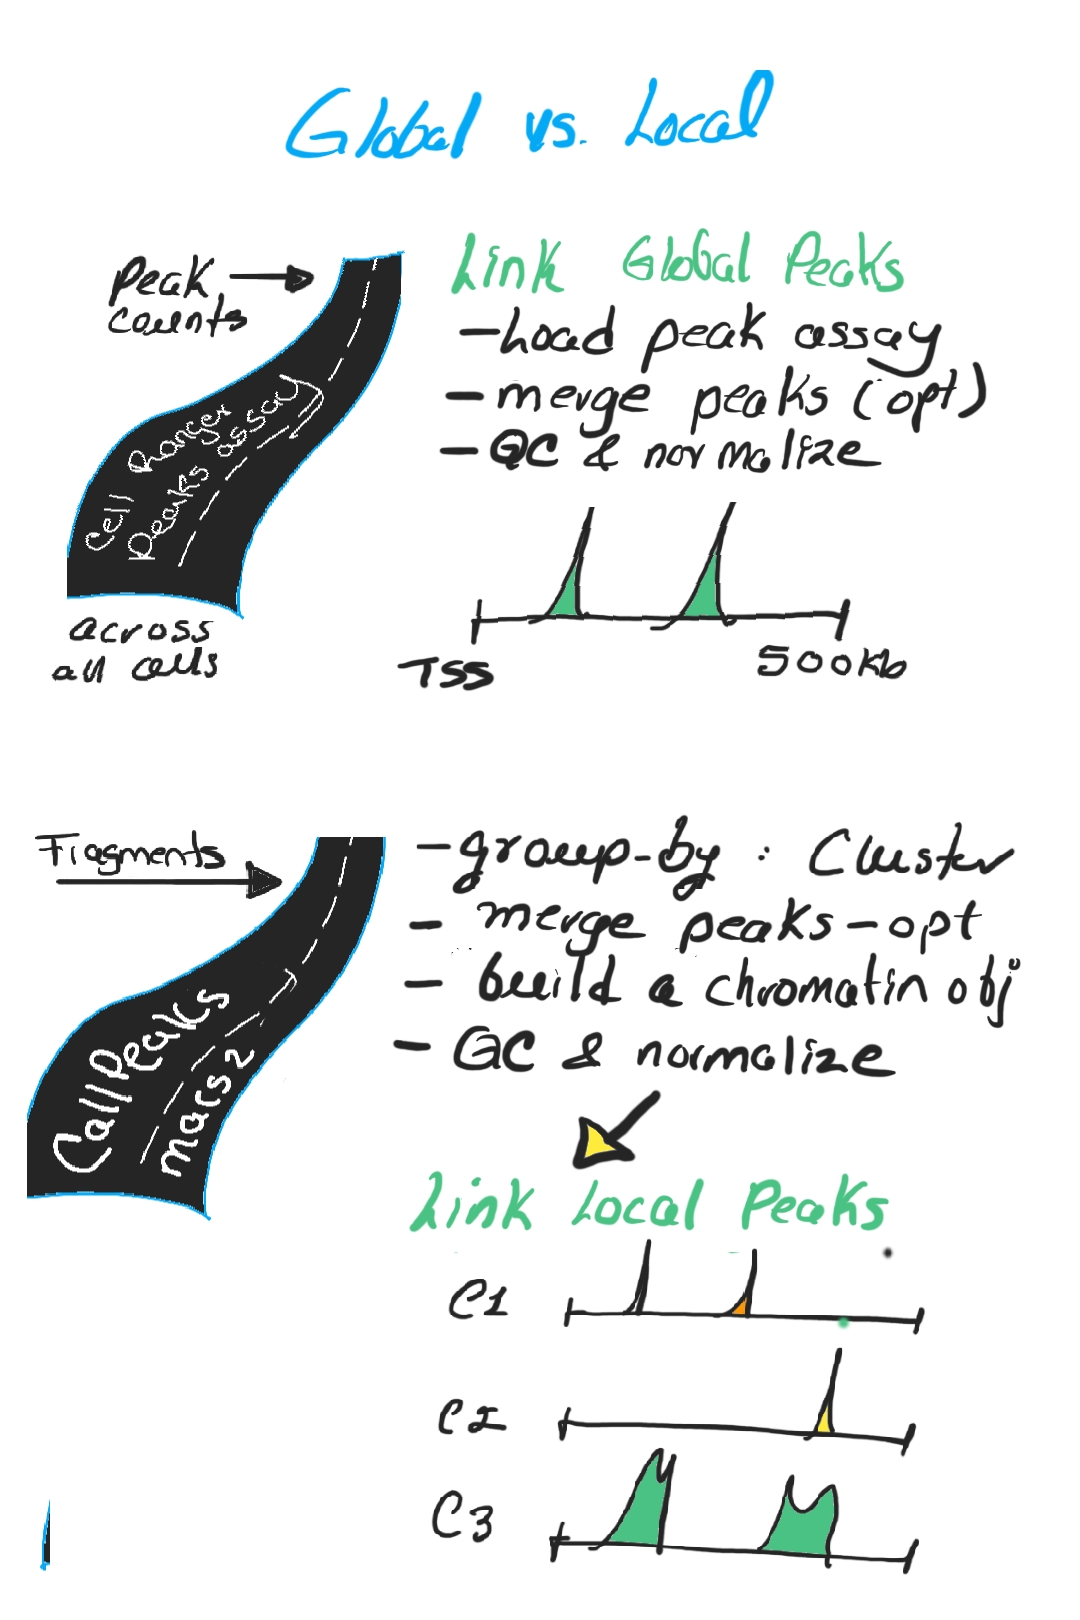
Next, we create a chromatin assay: performing GC bias correction, normalization (TF-IDF), and standardization. Then, using Signac::LinkPeaks, we correlate peaks with nearby genes across windows (e.g., ±500 kb around a TSS), evaluating the strength of each regulatory connection (Image 4).
There are two complementary strategies:
Global peak linking, where peaks are defined across all cells, merged, normalized, and then linked to genes (broad overview).
Local peak linking, where peaks are defined per cluster (via MACS2), quantified, normalized, and linked (more cell-type-specific view) (Image 5).
Global vs local peaks (click to open)
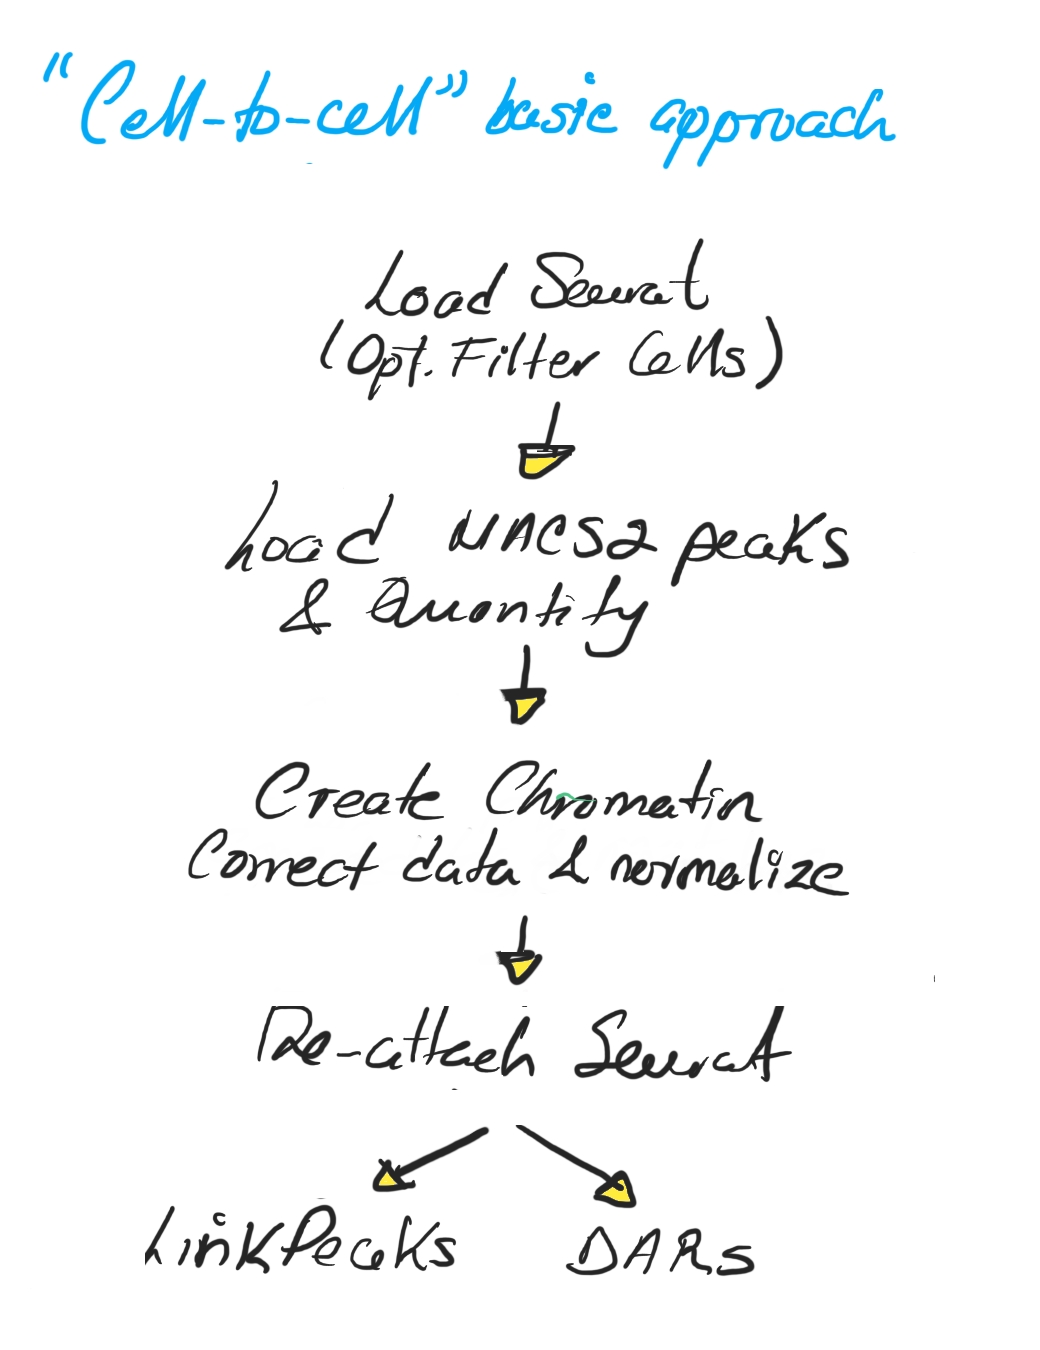
The basic “cell-to-cell” approach follows a straightforward workflow: load the Seurat object, load and quantify MACS2 peaks, build the chromatin assay, normalize, and then perform downstream analyses like LinkPeaks or differential accessibility (DARs) (Image 6).
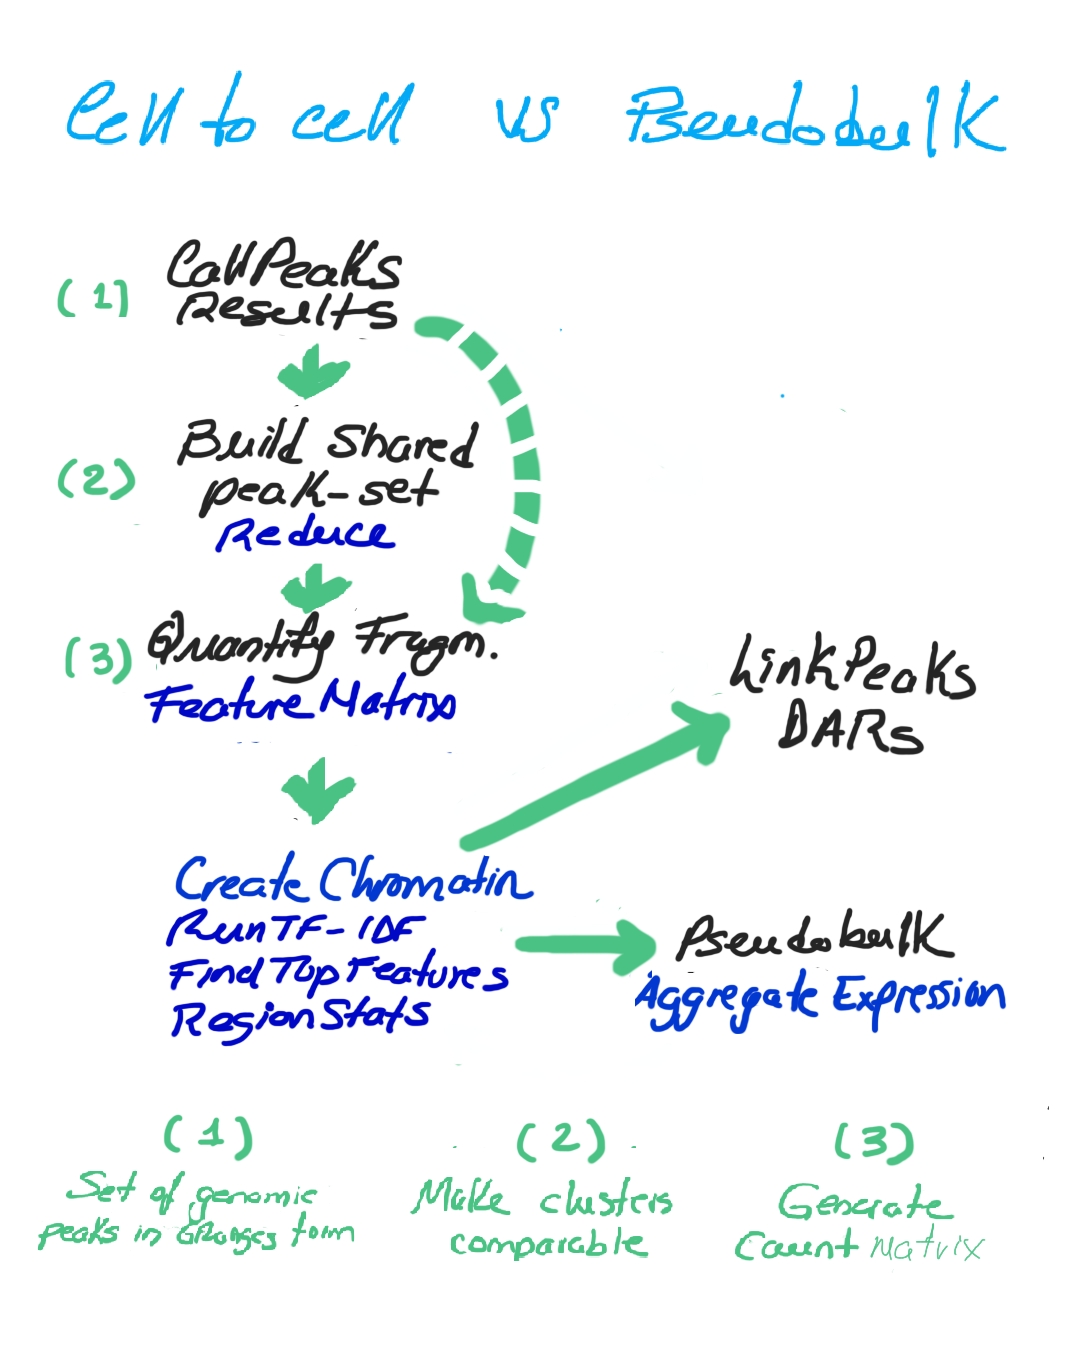
Finally, we can compare cell-to-cell vs pseudobulk strategies. In cell-to-cell, we build a shared peak set (using reduce), quantify fragments, and construct a chromatin assay for fine-grained resolution. In pseudobulk, we aggregate expression at the cluster level for broader, more robust signals. Both converge into analyses of peak–gene links and differential accessibility, but at different resolutions (Image 7).
Cell-to-cell vs pseudobulk (click to open)
Together, these steps form a pipeline for uncovering how chromatin accessibility influences gene expression across cell states, balancing global robustness with local specificity.
2. Technical Support Notes
a. Key Literature
-
Chawla et al., 2025 (Nat Genet)
Single-nucleus chromatin accessibility profiling identifies cell types and functional variants contributing to major depression.
DOI link
Includes code for DAR analysis (cell-type/cluster-specific cCREs and TFs): GitHub repo -
Zeng et al., 2024 (Science)
Genetic regulation of cell type–specific chromatin accessibility shapes brain disease etiology.
DOI link -
Anderson et al., 2023 (Cell Genomics)
Single nucleus multiomics identifies ZEB1 and MAFB as candidate regulators of Alzheimer’s disease-specific cis-regulatory elements.
DOI link
Includes code for peak calling: Workflow
b. Vignettes & Tutorials
- Data structures & object interaction (Signac)
- Linking peaks to genes (10x Multiome)
- Calling Peaks with MACS2
- Motif analysis with Signac
- Co-accessible networks with Cicero
c. Core Functions
- Signac
- GenomicRanges
- Seurat v5+
d. Custom Repo Practices
- Peak calling workflows: scMultiomics_AD repo
- Link detection strategies:
- Filter MACS peak calls (e.g., by expression or cell type).
- Keep only genes with sufficient UMIs (e.g., ≥200).
- Restrict peak–gene links by distance (≤100 kb from TSS).
- Example: link filtering.
e. Behind-the-Scenes Tools & File Formats
To run some functions, like Signac::CallPeaks (which internally invokes MACS), you might be interested in reading a bit about how MACS work, as you need to install it to let CallPeaks operate. Here, I am listing the most elementary resources for making happen, these are:
- MACS Project: GitHub and Changelog
- Installation: MACS2 guide and MACS3 guide
- BED = Browser Extensible Data format (standard for genomic intervals): UCSC FAQ
If you are wondering, Why get into BED format ? The short story is that CallPeaks() calls MACS2, which produces BED/narrowPeak files. Then Signac reads those into GRanges, discarding the need for you to handle files manually. The relation is direct: CallPeaks() = automated creation + import of MACS2 BED output into R
This matter if you want to:
Export: you can always exportSignac’s GRangespeaks back into aBED file(withrtracklayer::export()). Useful if you want to load them inIGV,UCSC Genome Browser, or compare withENCODE cCREs.Import: if you already haveBED peaks(e.g., ENCODE, or your own MACS2 runs outside of Signac), you can load them withrtracklayer::import()and use them directly in Signac.- Consistency: this BED ↔ GRanges conversion makes it easy to interoperate between R and external genomics tools.
Thanks for reading through these notes. I hope they give you a useful starting point or spark new ideas for your own analysis.
Feel free to share thoughts, suggestions, or resources. Collaboration makes the whole community stronger.
Until next time, happy exploring!
Cynthia SC