Cynthia SC (09-25-2025)
- But wait, What is indeed single cell analysis?
- Starting with Cell Ranger
- The 4 Core Steps of Cell Ranger
- References
Let’s start by talking about single-cell analysis, and it’s not just about RNA. The same approach can also be applied to DNA, proteins, and even metabolism. In this note, though, I’ll focus on the transcriptomic side (RNA), which remains the most widely adopted application of the technology so far.
It’s worth mentioning that there’s also a single-cell version of ATAC-seq, a powerful method for identifying active gene regulatory elements, mapping cell states, and tracing differentiation trajectories. I’ve covered those notes separately in another section.
Beyond that, the actual frontiers in single-cell is expanding beyond the initial individual “omics” layers into two major, interconnected areas: Multi-Omics and Spatial context. These may or may not be performed within the same experimental protocol, and integrating such diverse datasets is an entire topic of its own.
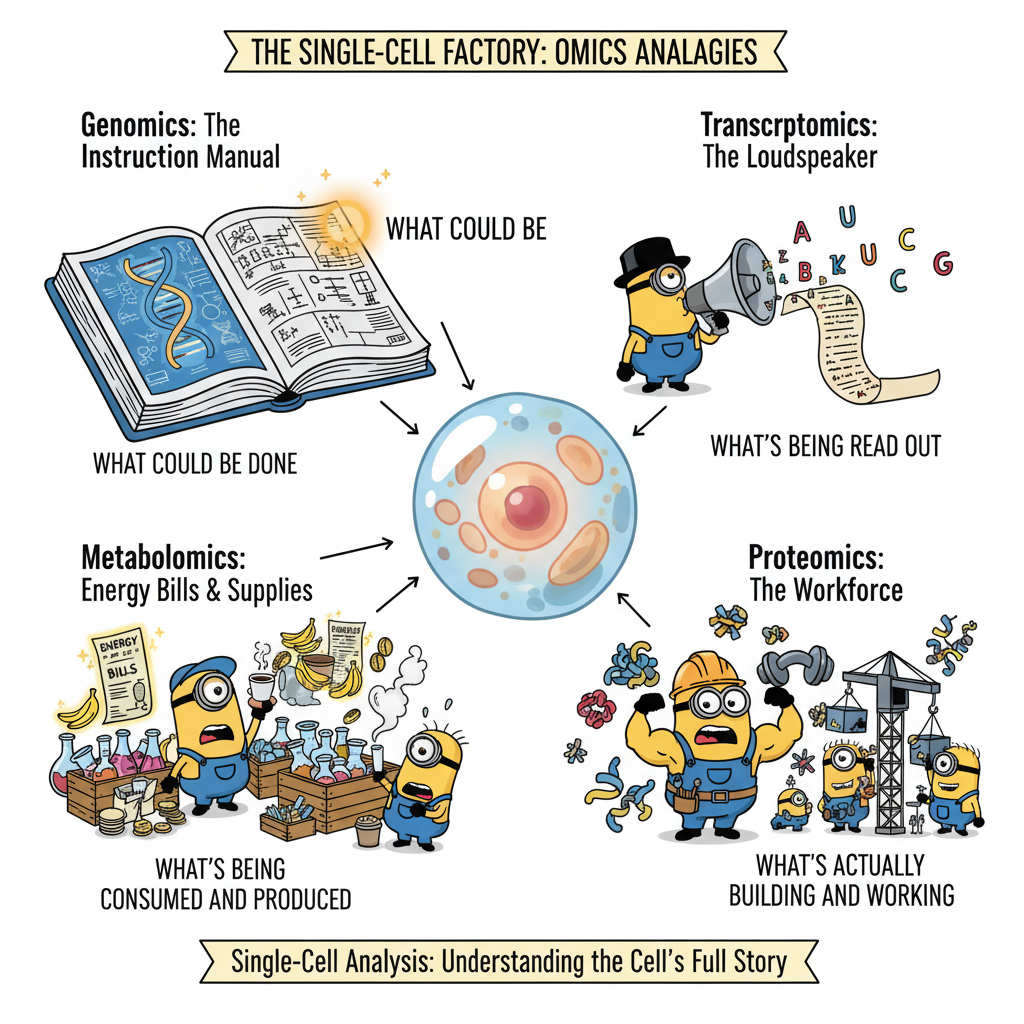
As way of illustration, the diagram represents 4 key players. And, as observed, all it happens looking at inside the cell. We have Genomics holding the “instruction manual” (the DNA double helix), showing what the cell could possibly do. While Transcriptomics is acting as the “loudspeaker” broadcasting which instructions are currently being read out. Proteomics is the muscular “workforce”, representing the actual functional molecules that build and perform all the cell’s tasks. Metabolomics is running around with all the stuff, keeping track of the “energy and supplies”, depicting the small chemicals consumed and produced to power the whole operation.
But wait, What is indeed single cell analysis?
When we think about biology, it’s easy to picture tissues, organs, or even whole organisms, but human-invisible action happens at the level of individual cells, where each cell carries its own blueprint, reads out specific sets of instructions, and plays a unique role in the bigger picture.
This is where single-cell analysis comes in. Instead of averaging signals across thousands or millions of cells, this field allows us to zoom in and study each cell on its own terms, whether that’s through genomics, transcriptomics, epigenomics, proteomics, or metabolomics. By teasing apart cellular diversity, researchers can uncover hidden subpopulations, map cell states, and gain a deeper understanding of how complex tissues function in both health and disease.
That’s exactly why platforms like 10x Genomics Chromium and its companion software, Cell Ranger, were developed: to bridge the gap between raw sequencing data and meaningful biological insights.
📺 In the video below (the first in a nine-part mini learning series), you’ll find a great introduction to single-cell techniques and how they compare with traditional bulk approaches such as PCR, microarrays, and bulk RNA-seq. The 10x Genomics website is also well-documented and packed with beginner-friendly resources if you’d like to explore further.
Starting with Cell Ranger
If you’ve just generated your first single-cell dataset with the 10x Genomics Chromium platform, chances are you’ll meet Cell Ranger. This is a suite of software that transforms raw sequencing output into clean, interpretable data.
Think of it as a way to take messy raw files and make the count matrices, quality metrics, and interactive reports, with relative few steps. From there, you can dive into clustering, dimensionality reduction, and downstream biological insights.
The 4 Core Steps of Cell Ranger
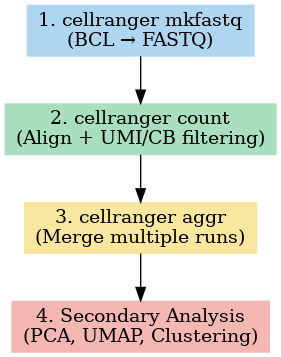
Here’s a bird’s-eye view of the core steps:
| Step | What Happens | What You Get |
|---|---|---|
cellranger mkfastq | Converts raw sequencing BCL files into FASTQ files and demultiplexes samples. | FASTQ files |
cellranger count | Aligns reads, identifies barcodes and UMIs, filters noise, and builds the expression matrix. | Gene-barcode matrix, BAM file, summary report, .cloupe file |
cellranger aggr | Combines results from multiple runs into one dataset. | Aggregated gene-barcode matrix |
Secondary Analysis | Calls real cells, reduces dimensions (PCA, UMAP/t-SNE), and clusters cells. | Filtered matrix + interactive Loupe Browser exploration |
In most workflows, you’ll receive sequencing data that’s already demultiplexed and aligned, making cellranger count your starting point. This step transforms raw reads into a gene-barcode matrix, the foundation for all downstream analyses. From here, you can assess quality metrics, explore clustering, and eventually uncover patterns of gene expression that shed light on cell identity, state, and function.
Hope you have a useful starting introduction. Dont’t miss my next notes talking about Modes to run Cell Ranger.
Cynthia SC
References
Tour of the Single Cell Analysis
Disclaimer: The characters in the image(s) are styled after the Minions, which are the copyrighted and trademarked property of Universal Studios / Illumination Entertainment. The image(s) was generated by a large language model based on a user-provided concept and is intended for illustrative and educational purposes only.